Counting the preferences
In Italy, much has been said about the winners and losers in the recent European Parliament elections. Much less, however, has been said of the gender and age of the candidates. Here’s an analysis based on the election data.

Counting the preferences
In Italy, much has been said about the winners and losers in the recent European Parliament elections. Much less, however, has been said of the gender and age of the candidates. Here’s an analysis based on the election data.
The new European Parliament should reach a new record when it comes to seats held by women. Some estimates claim an increase from 36 to 39 percent. However, these are still only estimates, since some official lists are still missing, including those of Italy, where the waivers of candidates in multiple constituencies are still required for a definitive count. Nevertheless, based on the unofficial numbers we can still say that women MEPs in Italy too have increased in number, growing from 28 to 32, out of 73 total Italian MEPs.
Apart from actual votes, the proportion of women elected to the representative assembly also depends on how many women are candidates, and on the rules of the electoral system , particularly the possibility (or lack thereof) for voters to express preferences for individual candidates. In some countries – including Romania, France, Germany, Spain – such preferences are not permitted: the list of candidates is chosen by the party alone, which then has full control of how seats are allocated, based on the number of votes received. In other cases, voters can choose their candidates by listing one or more individual candidates, as in Italy, Bulgaria and Croatia. Another way in which the electoral system can have an influence in this regard is the obligation (or lack thereof) to have a certain quota of women on the electoral lists, who are subsequently alternated with male candidates.
We’ve taken a close look at the Italian election data , and analysed the distribution of gender preferences. What do these preferences tell us about Italy?
One preference in three
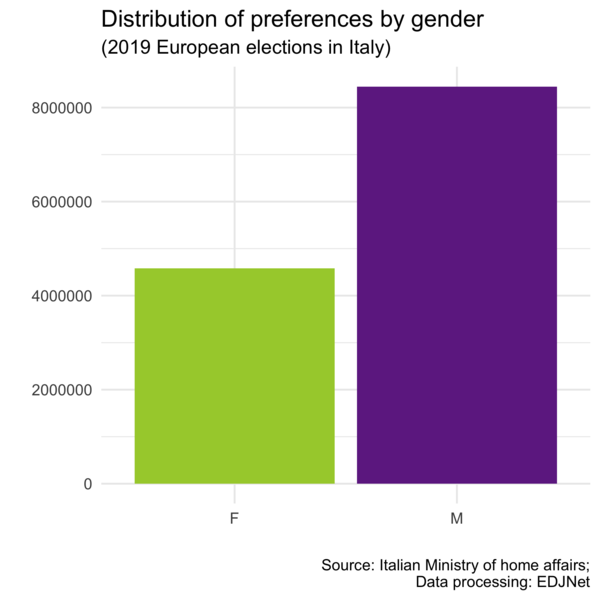
Let’s start with eligible voters and turnout. In Italy, female voters outnumber male voters (by about 1,700,000), and in the European elections women voted slightly more than men, at least in absolute terms: about 37,000 more (this also means that 54 percent of eligible female voters, as opposed to 58 percent of eligible male voters, participated in the election). However, male candidates received a whole lot more votes than female candidates.
Of 13 million preferences, only 35 percent were for women – even though they represent 50 percent of candidates, as required by the electoral rules. This gender disparity is less apparent when we exclude multiple candidacies, namely those who are candidates in multiple constituencies – party leaders or other high-profile figures, such as Matteo Salvini and Giorgia Meloni. For this analysis, we deliberately included all preferences, including these so-called multiple candidacies.
The distribution of preferences between men and women is still very unbalanced in Italy. Of course, this is due in part to male politicians being more recognisable: in many cases the female candidates were not exactly famous, and it couldn’t be said that they put much energy into their campaigns.
The list leaders of the various parties in the five constituencies were in 37 cases men (including Salvini, leading the list in every constituency) and in 22 cases women (with Giorgia Meloni again leading the list in every constituency). As it turns out, these are precisely the names which stand out among the preference votes. It should be noted that here that the list-leader for M5S (Five Star Movement) in every constituency was a woman.
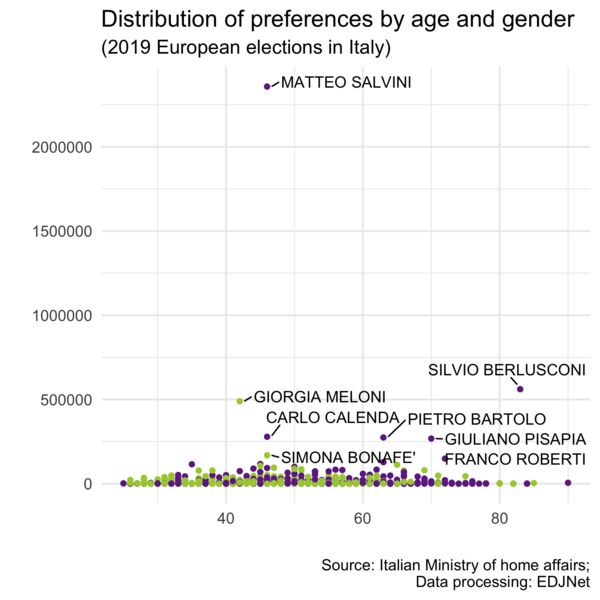
As the graphic shows, Giorgia Meloni (Fratelli d’Italia) and Simona Bonafè (PD) were the female candidates who received the most preference votes. Next are Caterina Chinnici and Irene Tinagli, both from Partito Democratico (PD), followed by Lega’s Mara Bizzotto.
Lists and municipalities with the most women elected
For certain parties, including M5S, Europa Verde and La Sinistra, the voter preferences were balanced between female and male candidates. Conversely, among the largest parties, Lega stands out with only 21 percent of preferences going to women – evidently shrouded by the personal success of Matteo Salvini, who all but monopolised the attention of his party’s electorate. Fratelli d’Italia, with lead candidate Giorgia Meloni, was the only party to receive more preferences for women (57 percent for female candidates, as opposed to 43 percent for male candidates).
In more than 640 municipalities, men received at least 80 percent of preferences (in six, male candidates received 100 percent of preferences). As for areas where women received more of the votes, this occurs in a small Sardinian village (Tinnura, in Oristano, with 67 percent for women, out of just 58 total votes) and Capannoli in Pisa. We can also mention Olmo Gentile: a municipality with a name (“gentle elm”) as sweet as its result (66.6 percent of preferences for women, or two in three).
While male candidates received disproportionate favour in places such as Treviso (77 percent), Trento and Piacenza (70 percent) and Bari (69 percent), the results in many of the larger cities were more balanced. Nevertheless, the only regional capital in which women received more preferences than men was Pisa.
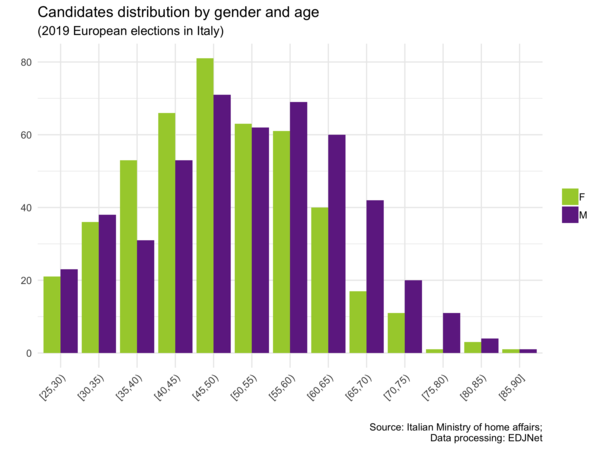
On average, women candidates were younger than their male counterparts. Apart from the 25-30 age group, where there were slightly more men, male candidates tend to dominate the older age ranges. With constituencies as large as those for the European elections (in Italy they can include as many as six different regions), fame and national media exposure surely helps.