
Climate warming in Europe, municipality by municipality
In more than 35,000 European municipalities, average temperatures have risen by more than 2°C over the last fifty years. From big cities to small villages, the climate crisis reaches every corner of Europe – but citizens are rising up, and people in power are finally taking action.

Babin Zub, Serbia (photo: Marco Verch/Flickr – CC BY 2.0 )
Climate warming in Europe, municipality by municipality
In more than 35,000 European municipalities, average temperatures have risen by more than 2°C over the last fifty years. From big cities to small villages, the climate crisis reaches every corner of Europe – but citizens are rising up, and people in power are finally taking action.
Babin Zub, Serbia (photo: Marco Verch/Flickr – CC BY 2.0 )
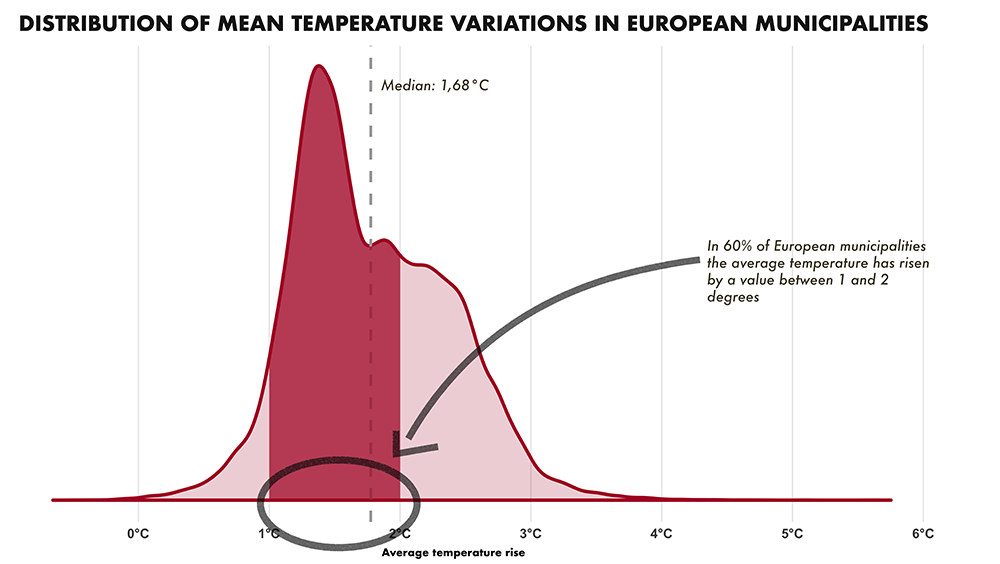
Fifty years of data for more than 100,000 European municipalities confirm that the continent is heating up at every latitude. In a third of these municipalities the average temperature has risen by more than 2°C between the 1960s and the last decade, with a difference as high as 5°C in certain areas. 73 of the 102,445 areas have seen average temperatures fall, though only by a few tenths of a degree.
All the data
Data for each municipality can be viewed here . Soon an interface will be available to make the data easier to navigate.
Two thirds of European provinces have experienced temperature increases between 1.5 and 2.5°C (by “provinces” here we mean NUTS3 regions ). These are average values for entire decades: small figures may therefore hide larger seasonal or annual variations. The estimates come from the European Union’s Copernicus programme, which tries to harmonise data over time and across borders, and develop estimates to fill any gaps.
OBCT/EDJNet
While global warming obviously hasn’t impacted all municipalities in the same way, in each of the 35 countries under consideration (excluding Malta) there is at least one municipality where the average temperature has increased by more than two degrees over the last half century, and in 23 countries there is at least one municipality where the estimated increase is by more than three degrees.
The capital cities of climate warming
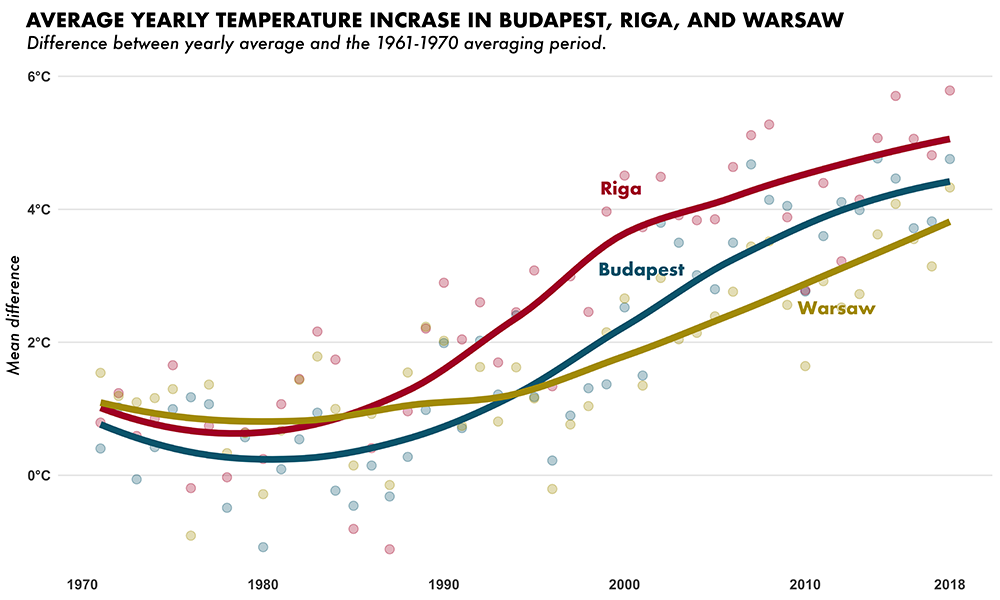
The factors leading to temperature increases are various, occurring at various levels and interacting in complex ways – there is no uniform explanation for the increases in each of the 100,000 municipalities. However, recurring elements can be observed: within each country, among the municipalities where temperatures have risen the most, we often find the capitals or their suburbs, especially in central-eastern Europe. This is true for Tallinn and Belgrade, but also Riga and Budapest, the two European capitals which – according to the data we rely on – have warmed most of all.
OBCT/EDJNet
Areas situated close to large airports also top the list: this is the case with the municipalities with the largest temperature increase, namely Reykjanesbær – located beside Iceland’s ever more popular international airport. The estimated increase here is a formidable 5.8°C in just a few decades.
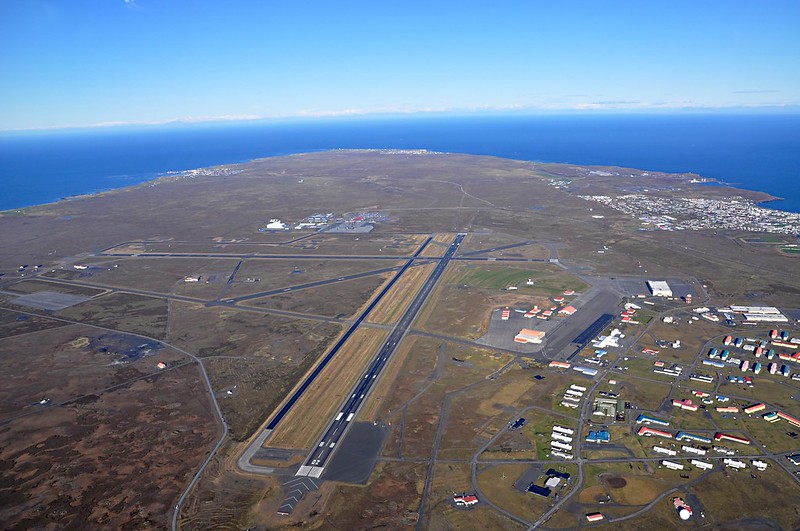
The area of Reykjanesbær and of the Keflavik airport in Iceland (photo: SuperJet International/Flickr)
In Budapest, temperatures have increased by 4°C according to Copernicus data. Hungarian meteorologists deem that the actual variation was a bit smaller – but it is a fact that the Carpathian basin has grown warmer at a faster rate than the European average, and is increasingly prone to drought and heat waves. The Hungarian capital also faces serious problems linked to heat islands and emissions from road traffic and domestic heating and air conditioning systems. “Asphalt and cars are everywhere. In some districts, there is less than one square metre of green areas per inhabitant. Because of real estate speculation, over the decades many green areas were turned into parking lots, malls and larger roads,” András Lukács, president of the environmental NGO Levegő Munkacsoport, tells us. “Outside the city center many people still use wood to warm their homes up in winter, and many households still burn waste”.
Winds of change
Hungarian environmental campaigns are intertwined with the political context. Since the October 2019 surprise victory of Gergely Karácsony, a member of Hungary’s green party, Budapest has had a mayor who cares about the environment. The city has declared an environmental state of emergency and is developing a strategy to eliminate harmful emissions: more energy efficiency, more green spaces, less road traffic.
Péter Vigh, director of Másfél fok , an awareness-raising project and information agency devoted to climate issues, argues that the Hungarian public is becoming more and more sensitive to climate change, to such an extent that politicians now feel they have to react. “In September 2019 around 8,000 people took part in the Global Climate Strike in Budapest, it was fantastic. In November we managed to shed light on the national consultation on the long-term strategy for the reduction of emissions required by EU norms, which went viral and turned into a very strong statement: even the Central Bank now promotes a green recovery from the pandemic. Mr. Orbán’s government is still implementing minimum measures regarding climate action, but it could respond to mounting pressure from below, as well as to the financial incentives made available by the EU”.
In Liverpool – another large European city where temperatures have risen the most in recent decades – environmentalists are also seeing a change in the political atmosphere. According to Frank Kennedy, an activist with Friends of The Earth , “for politicians and business-people it has become more difficult to ignore us. At least in word, they now recognise the scientific evidence. Over the last decades the discourse has all been focused on economic growth – and we’ve accepted whatever cost in order to draw investment”.
Greener valleys
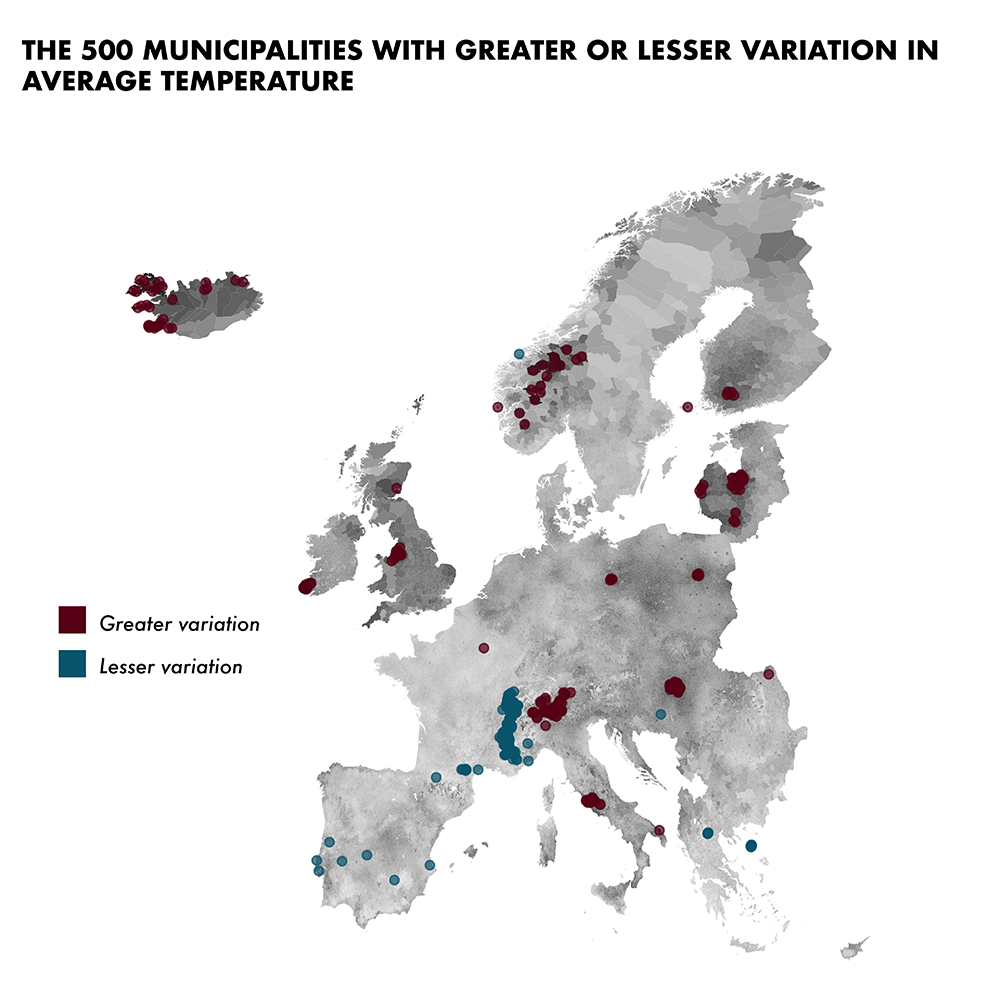
In some European countries, the municipalities warming fastest are in fact small villages, often quite isolated. This is the case with Llívia in Spain, and Monor in Romania: here, the problem is not with human activity, or heat islands, traffic, or industry. Rather, these are zones where global warming is increasingly felt due to geography – for example, the conformation of the land or the altitude. Similar reasons seem to play a role in European municipalities and provinces less affected by global warming, mainly along the Andalusian coast, the Aegean Sea and the French Alps.
OBCT/EDJNet
Leaving aside the extreme case of Iceland, eight of the ten European municipalities where temperatures have risen the most are found in central Norway. These are areas with only a few thousand inhabitants, located among peaceful, green valleys. These valleys, in fact, are getting greener: in each municipality the average annual temperature was clearly below zero in the 1960s, and now they have risen above zero.
This is confirmed by Markus Refsdal, representing the county of Innlandet for the environmental youth organisation Natur og Ungdom : “the climate is becoming increasingly unpredictable, in summer we have begun to see long periods of drought, followed by violent rainstorms. When my grandmother was young, during winter she could skate across the largest lake in Norway; I’ve never had such an opportunity”. Meteorological studies show winters becoming shorter, and snowfall becoming increasingly sparse : water reserves and hydroelectric production, Norway’s main sources of energy, are expected to be significantly impacted.
From Norway to Bulgaria, from Hungary to England: data shows that climate change has become tangible in many different corners of Europe. It is not only about global warming anymore, it is also about local warming. Journalism, civic engagement and political response will be effective only if they manage to connect the two levels, the one regarding the daily experience of a community and the one that affects Europe and the entire world – and which requires the adoption of adequate political initiatives.
Methodology
The data source we used was the UERRA regional reanalysis for Europe on single levels from 1961 to 2018 , created by Copernicus and by the European Centre for Medium-Range Weather Forecasts (ECMWF). The data provides estimated temperatures values at two meters and covers a cell grid, with cells 5,5×5,5 km large. It is worth noting that values are estimates, so they do not necessarily reflect actual measurements – for two main reasons: actual measurements are not available on this geographical and temporal scale; estimates also account for the possible changes in the surroundings of meteorological stations over time, thus enabling the comparison of data over several decades.
It is also worth noting that estimated values refer to cells, i.e. areas, and not to single points. Each European municipality was associated to the estimated temperature values of the cell where it lies – or of the cell where the main urban center of the municipality lies. This is worth keeping in mind especially in mountain areas, where even a cell 5,5×5,5 km large may include very different environments. The shape of the coastline was taken into account for cells partly covering sea areas, in order to reduce the distortion in estimated temperature values induced by large water surface.
For each cell, we worked on the raw data in order to obtain the mean estimated temperature values for the two decades taken into account (1961-1970 e 2009-2018), so as to calculate the estimated value of the occurred temperature variation. Climatologists tend to use longer temperature normals, with 30 years of data as baseline. There are various reasons for that choice, but given the descriptive aim of our analysis, and the straightforwardness of communicating differences between periods of the same length, we decided to employ 10 years averaging periods. You can find more details in this methodological note .
This article was updated on 4 August 2020, expanding the details on methodology for more clarity.