
Hungarians are more dissatisfied with their lives than EU citizens in general
An interesting survey result was published by the European Union: it gauged the life satisfaction of Europeans, and how this measures up with their overall happiness. The survey results show some improvement as they are better than last year’s. Yet Hungarians continue to lag behind, as we are shown to be far less happy than the average European.

Photo: Pxfuel | Creative Commons Zero - CC0
Hungarians are more dissatisfied with their lives than EU citizens in general
An interesting survey result was published by the European Union: it gauged the life satisfaction of Europeans, and how this measures up with their overall happiness. The survey results show some improvement as they are better than last year’s. Yet Hungarians continue to lag behind, as we are shown to be far less happy than the average European.
Photo: Pxfuel | Creative Commons Zero – CC0
The EU office of statistics Eurostat studied the level of life satisfaction and subjective well-being among the people of EU Member States. The poll is based on the 2018 study, though Slovakia, Ireland and Great Britain failed to provide data to several questions, and two non-EU states, Switzerland and Norway, were included. A similar study was conducted five years earlier, in 2013, and its results are comparable with the new one. We can generally observe that the overall level of satisfaction has risen with regards to people’s financial situation, job, personal and social relations.
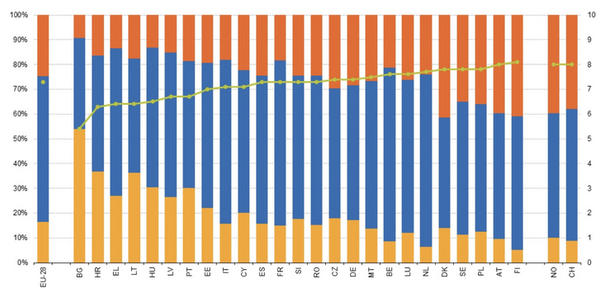
In 2018, the average satisfaction level in the Union was 7.3. Respondents gave scores of 0 to 10 points, with 0 for “not satisfied at all” and 10 for “fully satisfied”. The highest subjective well-being was measured in Austria, Finland, Norway and Switzerland, with values approaching or exceeding 8 points. The lowest score was produced in Bulgaria, where popular life satisfaction was estimated at 5.4. Lower-than-average scores were also recorded for Hungary, Croatia, Lithuania, Latvia and Portugal. The Hungarian score was far below the EU average, at 6.5.
Surveyors classified satisfaction levels into three groups: low (0-5), medium (6-8) and high (9-10). In 2018, the satisfaction score for 54% of the Bulgarian population was low, a far greater ratio of dissatisfaction than any other Member State, followed by Croatia with 36.8% and Lithuania with 36.2%. Bulgaria also counted the lowest ratio of highly satisfied individuals, merely 9.5%. Highly satisfied individuals also account for low proportions of the Hungarian and Greek population, 13.1% and 13.5% respectively.
On the other hand, ratios of high satisfaction are over 35% in Denmark (41.3%), Finland (41.1%), Austria, and Norway (39.7 %). Overall, the EU average is 16.5% for low life satisfaction, and 24.7% for high life satisfaction.
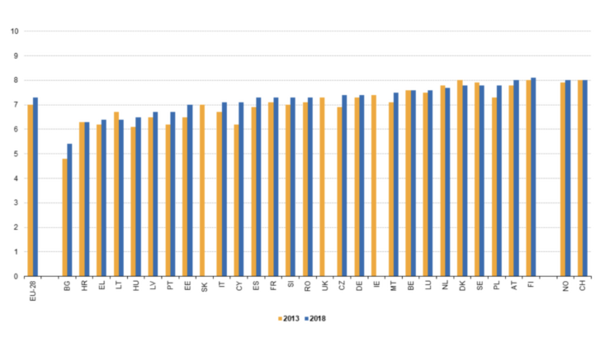
Compared to 2013, the overall EU average level of subjective well-being rose from 7 to 7.3 points. The greatest increase was found in Bulgaria and Cyprus, by 0.6, and 0.9 points respectively. During this time, the level fell slightly in Denmark, Holland and Sweden, with the greatest decrease of 0.3 points measured in Lithuania. Therefore, it can be said that between 2013 and 2018, the overall level of satisfaction increased in the EU.
If there was one Member State that stands out, it should be Cyprus. The island state has seen a 17% drop in low satisfaction, and 8% increase in high satisfaction.
Money, children, good jobs, partners and friends – these are what we need
Researchers used several aspects in examining the factors that influence satisfaction. In relation to age, they found that young people were the most satisfied. Age correlated negatively with satisfaction. Only 11% of the 16-24 age group reported being very dissatisfied, while they are 30% very dissatisfied among people aged over 70. And while 34% of young people were fully satisfied with their own lives, only 19% of elderly people reported being so.
There is also a strong link between educational accomplishment and satisfaction. Higher schooling correlates with higher life satisfaction. Those with a college-level education scored about a full point higher on average than respondents with intermediate education (7.8 and 6.8 points respectively).
It is no surprise that money also plays into how satisfied we feel, and more money does seem to bring more life satisfaction, as shown in Switzerland and Norway. The average satisfaction of those with lowest income is 6.6 points, and 7.8 points for those with the highest income. Finns and Austrians are happiest of the latter group, with 8.4 and 8.5 points on average.
It also appears that procreation is a source of life satisfaction, as respondents living in households with children scored an average of 7.5 points.
People’s financial situation has a considerable impact on how people assess the quality of their lives, either positively or negatively. In 2018, people’s average score for their financial situation was 6.5, which is 0.8 points below the average overall satisfaction. The highest scores for financial situation satisfaction came from Denmark, Finland, Sweden, and Norway (7.6), and the lowest from Bulgaria (4.3). Overall, the financial satisfaction value increased by 0.5 points in 5 years, with the sharpest increases recorded in Greece, Portugal and Cyprus. Only Lithuania and Switzerland produced a decrease in financial situation satisfaction.
There is also a close correlation between job and life satisfaction. The EU average score was 7.2 for satisfaction with one’s own job. This has not increased significantly since 2013, only by 0.1 points. The highest scores for job satisfaction came from Finland and Norway (8.1), followed closely by Austria (8), then Denmark, Estonia and Sweden (7.6 and 7.7 points). The two Member States with the lowest scores in this regard were Greece and Bulgaria, with only 6 points.
Finally, personal relationships also play an important role in one’s subjective well-being and life satisfaction. A well-functioning social environment ensures the essential balance between work and private life, and as the study shows, good personal relationships not only prevent isolation and loneliness, but also promote general well-being.
Most importantly, this single value is the highest in the EU, at 7.9 points. Solidly stable, it has only grown 0.1 points in 5 years. The highest values were recorded in Malta, Austria and Slovenia (8.6) and also in Switzerland, Sweden, Cyprus and Norway (8.5).
The happiness factor
Europeans were also asked about how happy they felt. In contrast to the previous questions, here the assessment called for an entirely subjective emotional evaluation.
A higher happiness score would also presumably correspond to higher general scores on other points. Here people were asked to state how frequently they felt happy in the past 4 weeks: always, most of the time, sometimes, seldom or never. Based on these responses, about 60% of the EU population reports being happy for most of the past 4 weeks; nearly 14% report being always happy, and 11% were only seldom or never happy. Based on the results, the happiest people are those in Finland, Austria, Holland and Belgium, where almost 76% of respondents reported being always or mostly happy, and only 5% reported being seldom or never happy.
Reported happiness is lowest for Latvia, Bulgaria and Greece. Nearly 30% of Latvians are only seldom or never happy.