
How to calculate travel distance between places and each point of the European population grid
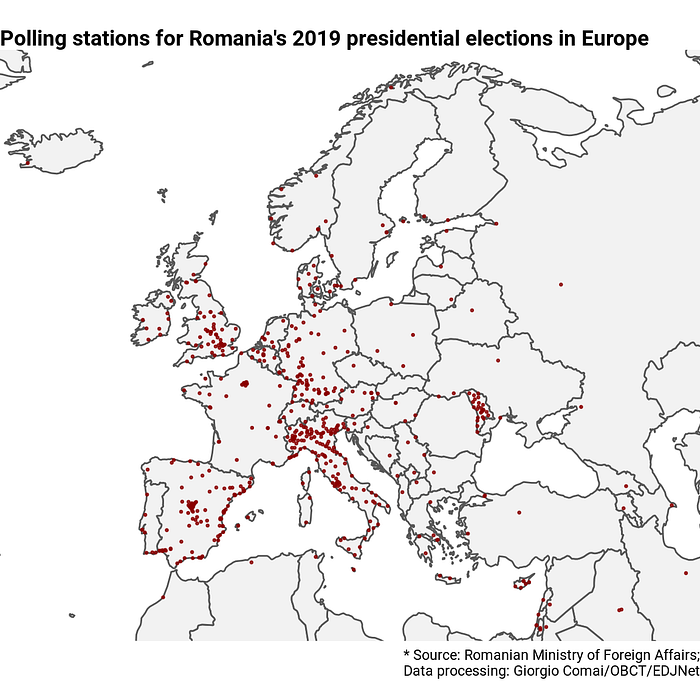
Almost one million Romanian citizens cast their ballot for the second turn of the Romanian presidential elections in November 2019 from abroad, largely thanks to the fact that more than 800 polling stations around the world remained opened from Friday through Sunday over the election week-end. In some parts of Europe, polling stations were available not only in capital cities or major urban centers, but also in relatively remote locations.
Indeed, it took me about 25 minutes on a rainy Sunday to drive my wife to a polling station from the small village in the Italian Alps where I live.

Looking at the density of polling stations in Italy on a map, I had the feeling that I was not exceptionally lucky, and that indeed many Romanian voters in Italy had a polling station within relatively easy reach. Or… was I? How far was the average Italian resident from a Romanian polling station on 24 November 2019? I decided to find out.
Finding the distance between residents and polling stations
How far is the average Italian resident from a polling station for Romania’s presidential elections? To answer this question, first we need to know where polling stations are located, second we need to know where Italian residents actually live, and then, well, calculate the distance.
- The Romanian Ministry of Foreign Affairs has published a map with all polling stations for the latest elections on its own website. I am not sure they published the coordinates of each location as open data, but, consciously or not, they let all addresses and coordinates in a nicely formatted json if you just look at the source code of that page (e.g. by doing ctrl+U with Firefox).
- Eurostat published back in 2011 a population grid of all of the EU. What is the population grid? Basically, it divides the surface of a country in squares of the size of 1km, and tells how many people live in each of these squares. Why do we need the population grid? Because we need to know that there are more residents in a urban center than on top of a mountain if we want to calculate meaningfully how long it would take for the average Italian to drive to a Romanian polling station.
Here is our data on a map, Romanian polling stations on top of Italy’s population grid:
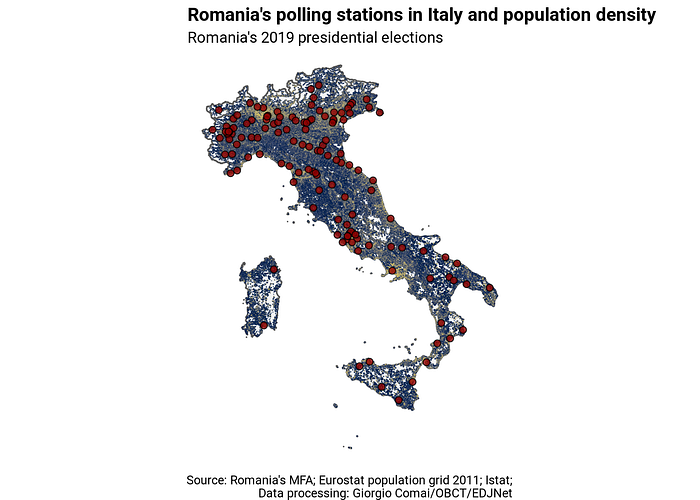
Now that we have the data, the answer to my question is “simple”: let’s measure the distance between each population grid cell and each polling station in Italy to find out which is the closest. Then it will be possible to calculate the mean (or median) distance, weighting for the number of residents living in each square kilometer that composes the grid.
There are 172,216 one-km cells in the Italian population grid, and, making no other assumption, we’ll check which is the closest polling station to each of them.
This a computing-intensive process (it took approximately 6 hours on my laptop), but hey, this is what computer were made for. So a few hours later, here is our long-coveted answer: on average, an Italian resident lives less than 18 km from a Romanian polling station.[note 1] Fifty per cent of Italians live less than 13km from a Romanian polling station.[2]
To summarise again how we reached this number: Eurostat publishes a population grid that tells how many people live in each square km of the continent. After having calculated the distance between the centre of each of these squares and the location of a Romanian polling station in Italy, we calculated a weighted mean value, “weighted” according to the number of people living in each square km, so that places with many residents in cities “weigh” more than places with few residents in the countryside.
But… but… do you think people fly to polling stations?
Yes, dear reader, you are right. I just calculated the distance “as the crow flies”. Mind you, I believe this information is very telling and impressive, as residents of most countries would likely need to drive hundreds of kilometers to reach a polling station if they are abroad on election day. But as you will surely remember from the beginning of this story, this author lives in the Alps, where mountains can, and indeed do, stand in the way between an Italian resident and their preferred Romanian polling station. Even worse, the wise Alpine resident knows from experience that what looks closest on a map does not necessarily mean easiest to reach.
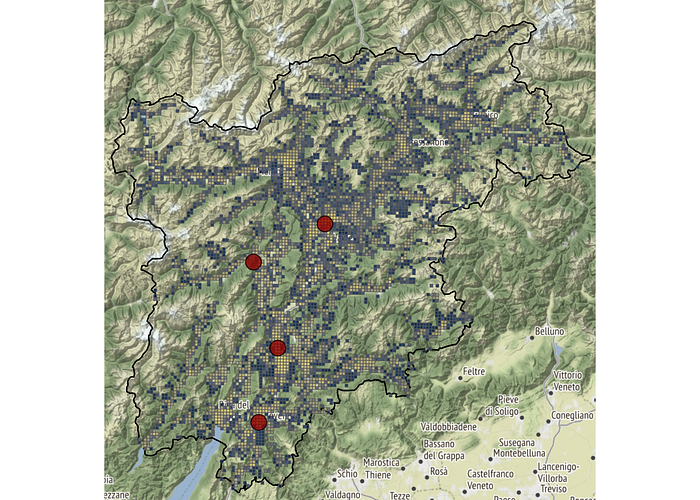
Let’s take it from the start looking at my native Trentino-Alto Adige/South Tyrol: population grid and Romanian polling stations.

Even if the map does not show the mountains, it is easy to guess from the population grid that they are there.

Let’s move on to a specific example. Let’s say that somebody in Vigo Cavedine, where part of my family hails from, wants to know how far they are from a Romanian polling station. They would soon find out that, as the crow flies, the closest polling station is in Rovereto, and is just 11 km from where they are.
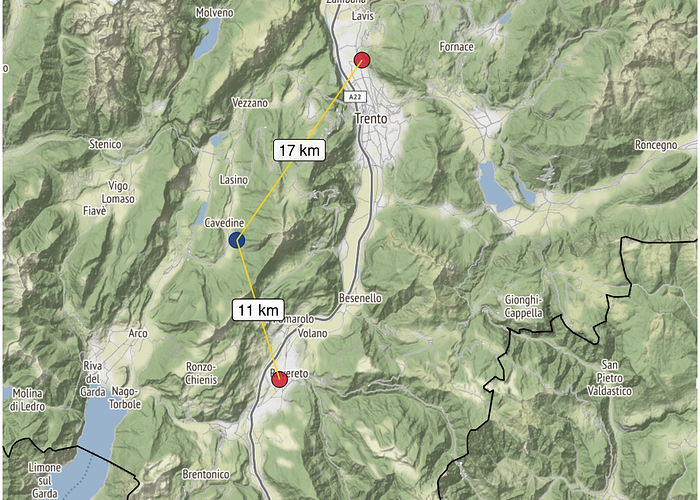
The good folks of Vigo Cavedine are however not so easily misled by all of these data. They know that Trento is actually easier to reach.[3]
And they are right:

Indeed, it takes about 10 minutes less to reach the polling station North of Trento than the one in Rovereto; by road, it’s also about 7 km closer.
Now, if we had to answer this question only for the good folks of Vigo Cavine, then we could just use Google Maps, or ask around, for that matter. The problem is that we want to find this figure for all 172,216 one-km cells of the Italian population grid. Since we cannot take for granted that “the closest” is also “the easiest to reach”, it means that we should make more than one query for each grid cell. Even if we check, say, for the 5 closest polling stations, that makes 861,080 queries. The lovely folks at Google charge 5 US dollars for each 1000 requests, which means… let me add up the numbers… 4,305 USD.
Not bad. But perhaps a bit on the expensive side of things for a rainy Sunday afternoon curiosity?
OpenStreetMap, which is reasonably complete in terms of road connections in Italy, comes to the rescue. Unfortunately, there’s no OpenStreetMap service that will let me make hundreds of thousands of queries for free, but hey, it’s open. I installed on my own laptop OSRM, the OpenStreetMap routing machine, downloaded the data for Italy (thanks OpenStreetMap contributors!), prepared them for routing, and… off we go.[4]
Since at this stage I had a routing engine on my laptop, and I could torture it as much as I liked, I did not even limit the number of polling stations to check, and had it calculate the distance between each grid cell and each polling station. Yes, that’s more than twenty million queries (distance and time are two separate queries)… just because I can, and because I don’t have to hand over to Google 116,246 dollars for the pleasure.
OSRM is really fast, and on my cheap laptop it crunched all of the above in about 15 hours.
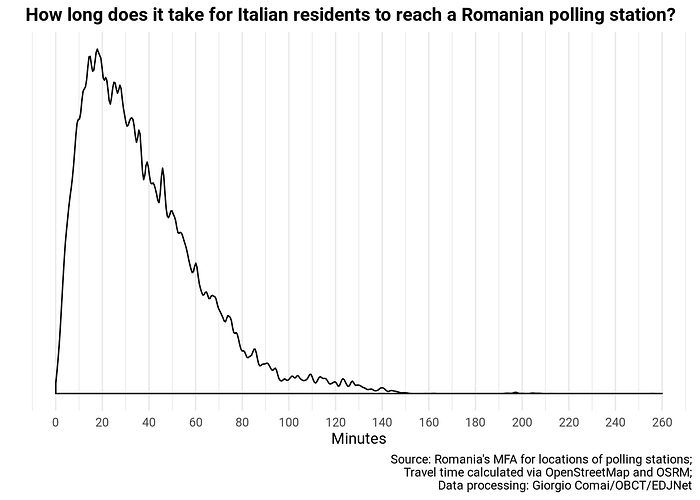
On a glorious Monday morning…
…I could wake up and feel that I was lucky. Even, better, I knew I was lucky.
On average, Italians would need to drive about 40 minutes to reach a Romanian polling station. Half of Italians could reach one in less than 35 minutes. But it took me only 25: I am officially lucky.
Notes
- You want the exact number emerging from the calculations? There you go: 17.691. The reader should be mindful that — as these calculations are based on the central location of 1km cells, there are substantial approximations involved.
- Yes, lovely folks who are fond of stats, this is the median you were all asking for: exactly 12.768. See previous footnote and keep in mind that we are not actually precise to the exact meter.
- By the way, did you see what I did there? Blue, yellow and red: it’s the Romanian flag!
- OSRM documentation is not too bad and it’s easy to install in a just a few command lines… they suggest to run OSRM in Docker, but I found it easier to deal with RAM issues just running it from the host. Preparing country-level data for routing may well take an hour or more, and you need to have about 10GB of RAM for a country the size of Italy (doing this with a Europe-wide map may not be a viable option on most consumer hardware). Downloading and extracting the data is just four lines of code, you find them in the full code version of this post.